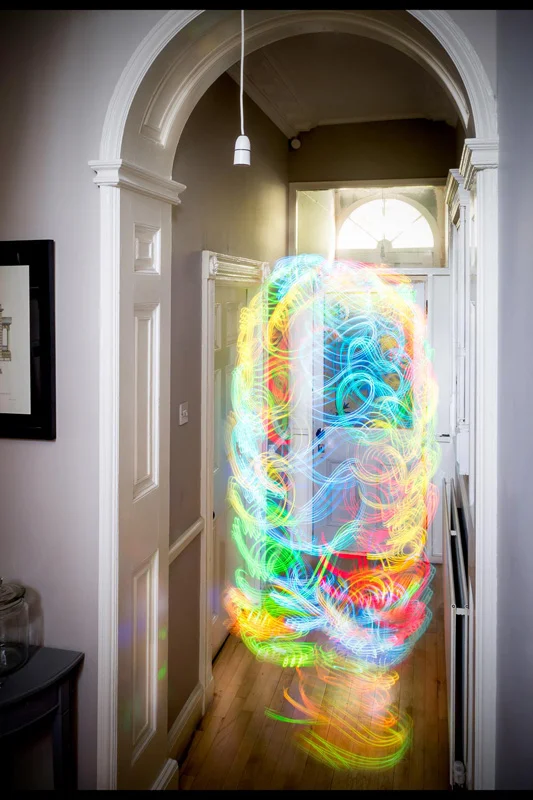
Hast Du schon mal Dein WiFi Netz visualisiert?
Nein, dann geht es Dir fast so wie mir, aber ich hab einfach mal damit angefangen und mir eine App aus dem Google Play Store gezogen und mein Haus fotografiert.Eigentlich eine simple Sache aber wir denken ja kaum noch darüber nach, dass wir uns immer in irgendwelchen Funkwellen, Funkfeldern, Radionetzen usw. bewegen. Man nehme die App namens Kirlian Device, welche bei unterschiedlichen Signalen die Farbe des Smartphone-Displays ändert und macht eine Langzeitbelichtung mit seiner Kamera. Soweit so gut, wenn ich die Ergebnisse dann auf Google+ hochlade, bekomme ich einen Autoeffekt der sich gewaschen hat. Ich gebe zu, es ist Spielerei und gewiss ausbaufähig, sieht aber auch verdammt geil aus ;).
Luis Hernan hat so ein schönes Projekt auf seiner Homepage und visualisierte mit seinem Kirlian Device schon einige Netzwerke. Dabei stellt er uns halt kostenlos eine Android App zur Verfügung um seine Fotografien auch erreichen zu können.
The Kirlian Device mobile is designed to reveal WiFi fields by means of long exposure photography and aural atmospheres. Download and use it with a long-exposure photograph to perform your own WiFi Visualisations, which will allow you to monitor the field strength and footprint of your WiFi network.
The current version of the app continuously reads the WiFi manager status, looks for the Received Signal Strength Index (RSSI) of the current connection and transforms the value into the corresponding colour from a five-colour heatmap scheme. Red means stronger signal, blue means weaker. In addition, it uses the RSSI value to emit a changing frequency sine-wave tone. The app maps values between -40 and -90 dB, but it is possible to adjust this threshold by pressing the "Calibrate" button provided in the main interface.
The app was created as part of a creative exploration project called Digital Ethereal, which sets out to understand and explore the spatial qualities and design potential of wireless exchange protocols, such as WiFi.
Soweit mir bekannt nutzt man sonst Kirlian Geräte um paranormale Dinge zu messen.
Hier kommen ein paar Fotos von Luis.
Hier geht es zu seiner Projekt Homepage Digital Ethereal


